Illustrating Data Hazards

A person with their hands on a laptop keyboard is looking at something happening over their screen with a worried expression. They are white, have shoulder length dark hair and wear a green t-shirt. The overall image is illustrated in a warm, sketchy, cartoon style. Floating in front of the person are three small green illustrations representing different industries, which is what they are looking at. On the left is a hospital building, in the middle is a bus, and on the right is a siren with small lines coming off it to indicate that it is flashing or making noise. Between the person and the images representing industries is a small character representing artificial intelligence made of lines and circles in green and red (like nodes and edges on a graph) who is standing with its ‘arms’ and ‘legs’ stretched out, and two antenna sticking up. A similar patten of nodes and edges is on the laptop screen in front of the person, as though the character has jumped out of their screen. The overall image makes it look as though the person is worried the AI character might approach and interfere with one of the industry icons.

We are delighted to start releasing some useful new images donated by the Data Hazards project into our free image library. The images are stills from an animated video explaining the project, and offer a refreshing take on illustrating AI and data bias. They take an effective and creative approach to making visible the role of the data scientist and the impact of algorithms, and the project behind the images uses visuals in order to improve data science itself. Project leaders Dr Nina Di Cara and Dr Natalie Zelenka share some background on Data Hazards labels, and the inspiration behind the animation behind the new images.

Data science has the potential to do so much for us. We can use it to identify new diseases, streamline services, and create positive change in the world. However, there have also been many examples of ways that data science has caused harm. Often this harm is not intended, but its weight falls on those who are the most vulnerable and marginalised. 

Often too, these harms are preventable. Testing datasets for bias, talking to communities affected by technology or changing functionality would be enough to stop people from being harmed. However, data scientists in general are not well trained to think about ethical issues, and even though there are other fields that have many experts on data ethics, it is not always easy for these groups to intersect. 

The Data Hazards project was developed by Dr Nina Di Cara and Dr Natalie Zelenka in 2021, and aims to make it easier for people from any discipline to talk together about data science harms, which we call Data Hazards. These Hazards are in the form of labels. Like chemical hazards, we want Data Hazards to make people stop and think about risk, not to stop using data science at all. 

An person is illustrated in a warm, cartoon-like style in green. They are looking up thoughtfully from the bottom left at a large hazard symbol in the middle of the image. The Hazard symbol is a bright orange square tilted 45 degrees, with a black and white illustration of an exclamation mark in the middle where the exclamation mark shape is made up of tiny 1s and 0s like binary code. To the right-hand side of the image a small character made of lines and circles (like nodes and edges on a graph) is standing with its ‘arms’ and ‘legs’ stretched out, and two antenna sticking up. It faces off to the right-hand side of the image.
Yasmin Dwiputri & Data Hazards Project / Better Images of AI / Managing Data Hazards / CC-BY 4.0

By making it easier for us all to talk about risks, we believe we are more likely to see them early and have a chance at preventing them. The project is open source, so anyone can suggest new or improved labels which mean that we can keep responding to new and changing ethical landscapes in data science. 

The project has now been running for nearly two years and in that time we have had input from over 100 people on what the Hazard labels should be, and what safety precautions should be suggested for each of them. We are now launching Version 1.0 with newly designed labels and explainer animations! 

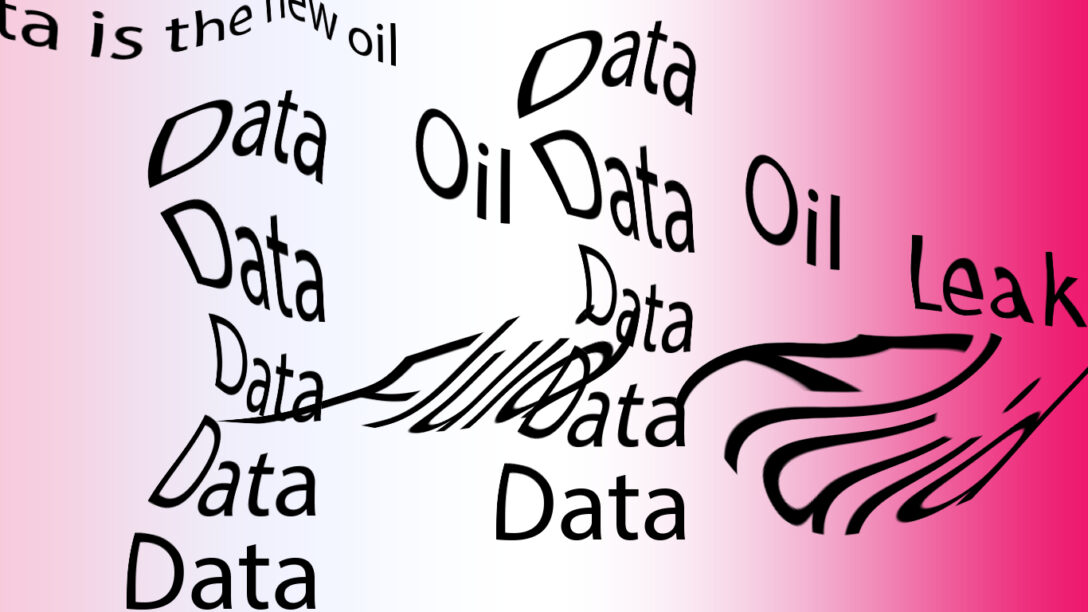
Chemical hazards are well known for their striking visual icons, which many of us see day-to-day on bottles in our homes. By having Data Hazard labels, we wanted to create similar imagery that would communicate the message of each of the labels. For example, how can we represent ‘Reinforces Existing Bias’ (one of the Hazard labels) in a small, relatively simple image? 

Icon

Description automatically generated
Image of the ‘Reinforces Existing Bias’ Data Hazard label

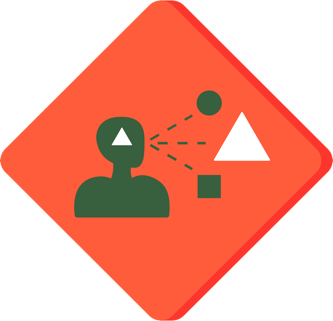
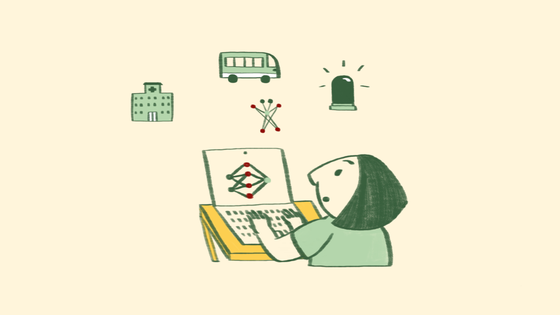
We also wanted to create some short videos to describe the project, that included a data scientist character interacting with ‘AI’ and had the challenge of deciding how to create a better image of AI than the typical robot. We were very lucky to work with illustrator and animator Yasmin Dwiputri, and Vanessa Hanschke who is doing a PhD at the University of Bristol in understanding responsible AI through storytelling. 

We asked Yasmin to share some thoughts from her experience working on the project:

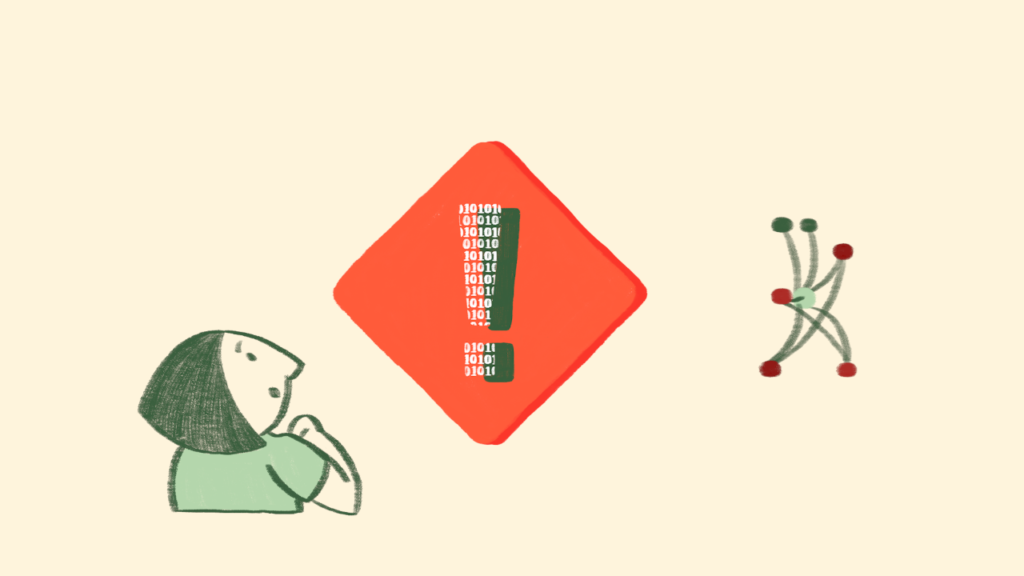
“The biggest challenge was creating an AI character for the films. We wanted to have a character that shows the dangers of data science, but can also transform into doing good. We wanted to stay away from portraying AI as a humanoid robot and have a more abstract design with elements of neural networks. Yet, it should still be constructed in a way that would allow it to move and do real-life actions.

We came up with the node monster. It has limbs which allow it to engage with the human characters and story, but no facial expressions. Its attitude is portrayed through its movements, and it appears in multiple silly disguises. This way, we could still make him lovable and interesting, but avoid any stereotypes or biases.

As AI is becoming more and more present in the animation industry, it is creating a divide in the animation community. While some people are praising the endless possibilities AI could bring, others are concerned it will also replace artistic expressions and human skills.

The Data Hazard Project has given me a better understanding of the challenges we face even before AI hits the market. I believe animation productions should be aware of the impact and dangers AI can have, before only speaking of innovation. At the same time, as creatives, we need to learn more about how AI, if used correctly, and newer methods could improve our workflow.”

Yasmin Dwiputri

Now that we have the wonderful resources created we have been able to release them on our website and will be using them for training, teaching and workshops that we run as part of the project. You can view the labels and the explainer videos on the Data Hazards website. All of our materials are licensed as CC-BY 4.0 and so can be used and re-used with attribution. 

We’re also really excited to see some on the Better Images of AI website, and hope they will be helpful to others who are trying to represent data science and AI in their work. A crucial part of AI ethics is ensuring that we do not oversell or exaggerate what AI can do, and so the way we visualise images of AI is hugely important to the perception of AI by the public and being able to do ethical data science! 

Cover image by Yasmin Dwiputri & Data Hazards Project / Better Images of AI / AI across industries / CC-BY 4.0

Why Metaphors matter: How we’re misinforming our children about data

An abstract illustration with fluid words spelling Data, Oil, Fluid and Leak

Have you ever noticed how often we use metaphors in our day-to-day language? The words we use matter, and metaphorical language paints mental pictures imbued with hidden and often misplaced assumptions and connotations. In looking at the impact of metaphorical images to represent the technologies and concepts covered within the term artificial intelligence, it can be illuminating to drill down into one element of AI – that of data.

Hattusia recently teamed up with Jen Persson at Defend Digital Me and The Warren Youth Project to consider how the metaphors we attach to data impacts UK policy, amalgamating in a data metaphors report.

In this report, we explore why and how public conversations about personal data don’t work. We suggest what must change to better include children for the sustainable future of the UK national data strategy.

Our starting point is the influence of common metaphorical language: how does the way we talk about data affect our understanding of it? In turn, how does this inform policy choices, and how children feel about the use of data about them in practice?

Still from a video showing Alice Thwaite being interviewed
Watch the full video and interview here

Metaphors are routinely used by the media and politicians to describe something as something else. This brings with it associations made in response in the reader or recipient. We don’t only see the image but receive the author’s opinion or intended meaning on something.

Metaphors are very often used to influence the audience’s opinion. This is hugely important because policymakers often use metaphors to frame and understand problems – the way you understand a problem has a big impact on how you respond to it and construct a solution.

Looking at children’s policy papers and discussions about data in Parliament since 2010, we worked with Julia Slupska to identify three metaphor groups most commonly used to describe data and its properties.

We found that ​​a lot of academic and journalistic debates frame data as ‘the new oil’, for example; while some others describe it as toxic residue or nuclear waste. The range of metaphors used by politicians is more narrow and rarely as critical.

Through our research, we’ve identified the three most prominent sets of metaphors for data used in reports and policy documents. These are:

  • Fluid: data can flow or leak
  • A resource/fuel: data can be mined, can be raw, data is like oil
  • Body or bodily residue: data can be left behind by a person like footprints; data needs protecting

In our workshop at The Warren Youth Project , the participants used all of our identified metaphors in different ways. Some talked about the extraction of data being destructive, while others compared it to a concept that follows you around from the moment you’re born. Three key themes emerged from our discussions:

  • Misrepresentation: the participants felt that data was often inaccurate, or used by third parties as a single source of truth in decision-making. In these cases, there was a sense that they had no control over how they were perceived by law enforcement and other authority figures.
  • Power hierarchies and abuses of power: this theme came out via numerous stories about those with authority over the participants having seemingly unfettered access to their data, thus enforcing opaque processes, leaving the participants powerless and with no control.
  • The use of data ‘in your best interest’: there was unease expressed over data being used or collected for reasons that were unclear and defined by adults, leaving children with a lack of agency and autonomy.

When looking into how children are framed in data policy, we found they are most commonly represented as criminals or victims, or simply missing in the discussion. The National Data Strategy makes a lot of claims of how data can be of use to society in the UK, but only mentions children twice and mostly talks about data like it is a resource to be exploited for economic gain.

The language in this strategy and other policy documents is alienating and dehumanises children into data points for the purpose of predicting criminal behaviour or to attempt to protect them from online harm. The voices of children themselves are left out of the conversation entirely. We propose new and better ways to talk about personal data.

To learn more about our research, watch this video (produced by Matt Hewett) in which I discuss the findings. It breaks down exactly what the three groups were, how the experiences which young people and children had related to data linked back to those three groups, and how changing the metaphors we use when we talk about data could be key to inspiring better outcomes for the whole of society.

We also recommend looking at the full report on the Defend Digital Me website here

From Black Box to Algorithmic Veil: Why the image of the black box is harmful to the regulation of AI

An abstract image containing stylized black cubes and a half-transparent veil infront of a night street scene

The following is based on an excerpt of the upcoming book “Self-imposed Algorithmic Thoughtlessness and the Automation of Crime Control”, Nomos/Hart 2022 by Lucia Sommerer


Language is never innocent: words possess a secondary memory, which in the midst of new meanings mysteriously persists.

Roland Barthes1

The societal, as well as the scholarly discussion about new technologies, is often characterized by the use of metaphors and analogies. When it comes to the legal classification of new technologies, Crootof even speaks of a ‘battle of analogies’2. Metaphors and analogies offer islands of familiarity when legally navigating through the floods of complex technological evolution. Metaphors often begin where the intuitive understanding of new technologies ends.3 The less familiar we feel with a technology, the greater our need for visual language as a set of epistemic crutches. The words that we choose to describe our world, however, have a direct influence on how we perceive the world.4 Wittgenstein even argues that they represent the boundaries of our world.5 Metaphors and analogies are never neutral or ‘innocent’, as Barthes puts it, but come with ‘baggage’6, i.e. metaphors in the digital realm are loaded with the assumptions of the analogue world from which the imagery is borrowed.7 Consider the following question about one of the most widespread metaphors on the subject of algorithms, the black box:

What do you see before your inner eye, when you hear the term ‘black box’?

Some people may think of a monolithic, robust, opaque, dark and square figure.

What few people will see is humans.

This demonstrates both the strengths and the weaknesses of the black box image and thus its Janus-headedness. In the discussion about algorithms, the black box narrative was originally intended as a ‘wake-up call’8 to direct our attention – through memorable visual language – towards certain risks of algorithmic automation; namely towards the risks of a loss of (human) control and understandability. The black box terminology successfully fulfils this task.

But it also threatens to obscure our view of the people behind algorithmic systems and their value judgements. The black box image conceals an opportunity to control the human decisions behind an algorithmic system and falsely suggests that algorithms are independent of human prejudices. By drawing attention to one problem area of the use of algorithms (non-transparency), the black box narrative threatens to distract from others (controllability, hidden human value judgements, lack of neutrality). The term black box hides the fact that algorithms are complex socio-technical systems9 that are based on a multitude of different human decisions10. Further, by presenting algorithmic technology as a monolithic, unchangeable and incomprehensible black box, connotations such as ‘magical’ and ‘oracular’ often arise.11 Instead of provoking criticism, such terms often lead to awe and ultimately surrender to the opacity of the black box. Our options for dealing with algorithms are reduced to ‘use vs. do not use’. Opportunities that would allow for nuances in the human design process of the black box go unnoticed. The inner processes of the black box as a system are sealed off from humans and attributed an inevitability that strongly resembles the inevitability of the forces of nature; forces that can be ‘tamed’ but never systematically controlled.12 The black box narrative also ascribes such problematic inevitability to negative side effects such as the discriminatory effects of an algorithm. This view diverts attention away from the very human-made sources of algorithmic discriminatory behaviour (e.g. selection of training data). The black box narrative in its most widespread form – namely as an unreflected catchphrase – paradoxically achieves the opposite of what it is intended to do; namely, to protect us from a loss of control over algorithms.

In reality it is, however, possible to disclose a number of human value judgements that stand behind even supposed black box algorithm, for example, through logging requirements in the design phase or output testing.

The challenge posed by the regulation of algorithms, therefore, is more appropriately described as an ‘algorithmic veil’ than a black box; an ‘algorithmic veil’ that is placed over human decisions and values. One advantage of the metaphor of the veil is that it almost inherently invites us to lift it. A black box, on the other hand, does not contain such a prompt. Quite the opposite: a black box indicates that an attempt to gain any insight whatsoever is unlikely to succeed. The metaphors we use in the discussion about algorithms, therefore, can directly influence what we think is possible in terms of algorithm regulation. By conjuring up the image of the flowing fabric of an algorithmic veil, which only has to be lifted, instead of a massive black box, which has to be broken open, my intention is not to minimize the challenges of algorithm regulation. Rather, the veil should be understood as an invitation to society, programmers and scholars: instead of talking about what algorithms ‘do’ (as if they were independent actors), we should talk about what the human programmers, statisticians, and data scientists behind the algorithm do. Only when this perspective is adopted can algorithms be more than just ‘tamed’, i.e., systematically controlled by regulation.


1 Roland, Writing Degree Zero, New York 1968, 16.
2 Thomson-DeVeaux FiveThirtyEight v. 29.5.2018, https://perma.cc/YG65-JAXA.
3 So-called cognitive metaphor, cf. Drewer, Die kognitive Metapher als Werkzeug des Denkens. Zur Rolle der Analogie bei der Gewinnung und Vermittlung wissenschaftlicher Erkenntnisse, Tübingen 2003.
4 Lakoff/Johnson, Metaphors We Live By, Chicago 2003; Jäkel, Wie Metaphern Wissen schaffen: die kognitive Metapherntheorie und ihre Anwendung in Modell-Analysen der Diskursbereiche Geistestätigkeit, Wirtschaft, Wissenschaft und Religion, Hamburg 2003.
5 Wittgenstein, Tractatus Logico-Philosophicus – Logisch-Philosophische Abhandlung, Berlin 1963, Satz 5.6.
6 Lakoff/Wehling, „Auf leisen Sohlen ins Gehirn.“ Politische Sprache und ihre heimliche Macht, 4. Aufl., Heidelberg 2016, 1 ff. speak of the so-called ‘Issue Defining Frame’.
7 See for example how metaphors differently relate to the data we unconsciously leave behind on the Internet: data as the ‘new oil’ (Mayer-Schönberger/Cukier, Big Data – A Revolution that will transform how we live, work and think, New York 2013, 20), ‘data waste’ (Harford, Significance 2014, 14 (15)) or ‘data extortion’ (Singer/Maheshwari The New York Times v. 25.4.2017, https://perma.cc/9VF8-J7F7). A metaphor’s starting point has great significance for the outcome of a discussion, as Behavioral Economics Research under the heading of ‘Anchoring’ has shown, see Kahneman, Thinking, Fast and Slow, London 2011, 119 ff.
8 In this sense, Pasquale, The Black Box Society – The Secret Algorithms That Control Money and Information, Cambridge et al. 2015.
9 Cf. Simon, in: Floridi (Hrsg.), The Onlife Manifesto – Being Human in a Hyperconnected Era, Heidelberg et al. 2015, 145 ff., 146; for the corresponding work of the Science & Technology Studies see Simon, Knowing Together: a Social Epistemology for Socio-Technical Epistemic Systems, Diss. Univ. Wien, 2010, 61 ff. m.w.N..
10 See Lehr/Ohm, UCDL Rev. 2017, 653 (668) (‘Out of the ether apparently springs a fully formed “algorithm”’) .
11 Elish/boyd, Communication Monographs 2017, 1 (6 ff.);Garzcarek/Steuer, Approaching Ethical Guidelines for Data Scientists, arXiv 2019, https://perma.cc/RZ5S-P24W (‘algorithms act very similar to ancient oracles’); science fiction framing and a reference to the book/film Minority Report, in which human oracles predict murders with the help of technology, are also frequently found; see Brühl/Steinke Süddeutsche Zeitung v. 4.3.2019, https://perma.cc/6J55-VGCX; Stroud Verge v. 19.2.2014, http://perma.cc/T678-AA68.
12 Similarly, as early as 20 years ago, Nissenbaum, Science and Engineering Ethics 1996, 25 (34).

Title image by Alexa Steinbrück